
Feature Overview
The Forecast Module provides a comprehensive view of your sales pipeline, allowing you to visualize closed deals, active opportunities, and at-risk revenue for any selected time period. This interactive dashboard gives you real-time insights into your team's performance against targets, with the ability to drill down into specific deals for more detailed analysis.
Benefits to the User
- Clear Pipeline Visibility: See your entire pipeline at a glance with color-coded sections for closed, healthy, and at-risk deals
- Accurate Forecasting: Compare your current performance against targets with weighted forecasts based on deal probabilities
- Team Performance Tracking: Filter by teams or individual team members to assess performance at any organizational level
- Flexible Time Periods: Customize date ranges to focus on this quarter, next quarter, or any custom time period
- Deal-Level Analysis: Drill down from high-level forecasts to individual opportunity details with just a few clicks
- Pipeline Segmentation: Toggle between all pipelines, deal pipelines, or renewal pipelines for targeted analysis
Accessing the Feature
- Navigate to the "Sales Engine" section in the main nav
- Click on the "Forecast" page
- The forecasting modules will appear, displaying your default view
Step-by-Step Usage Guide
Setting Your View Parameters
- Select Pipeline Type
- At the top of the page, use the filter to select from:
- All Pipelines
- Deal Pipelines
- Renewal Pipelines
- At the top of the page, use the filter to select from:
- Choose Time Period
- On the right side of the page, select from:
- This Quarter (default)
- Next Quarter
- Both Quarters
- Custom
- If selecting "Custom":
- Specify a start date
- Specify an end date
- The date range will update and filter results accordingly
- On the right side of the page, select from:
- Filter by Team
- In the middle section, use the search function to find specific teams
- Select from available options:
- Main/Parent Team (all teams)
- Sub Teams
- Filter by Team Member
- After selecting your team view, you can:
- View forecasting for all team members (default)
- Filter by a specific team member
- After selecting your team view, you can:
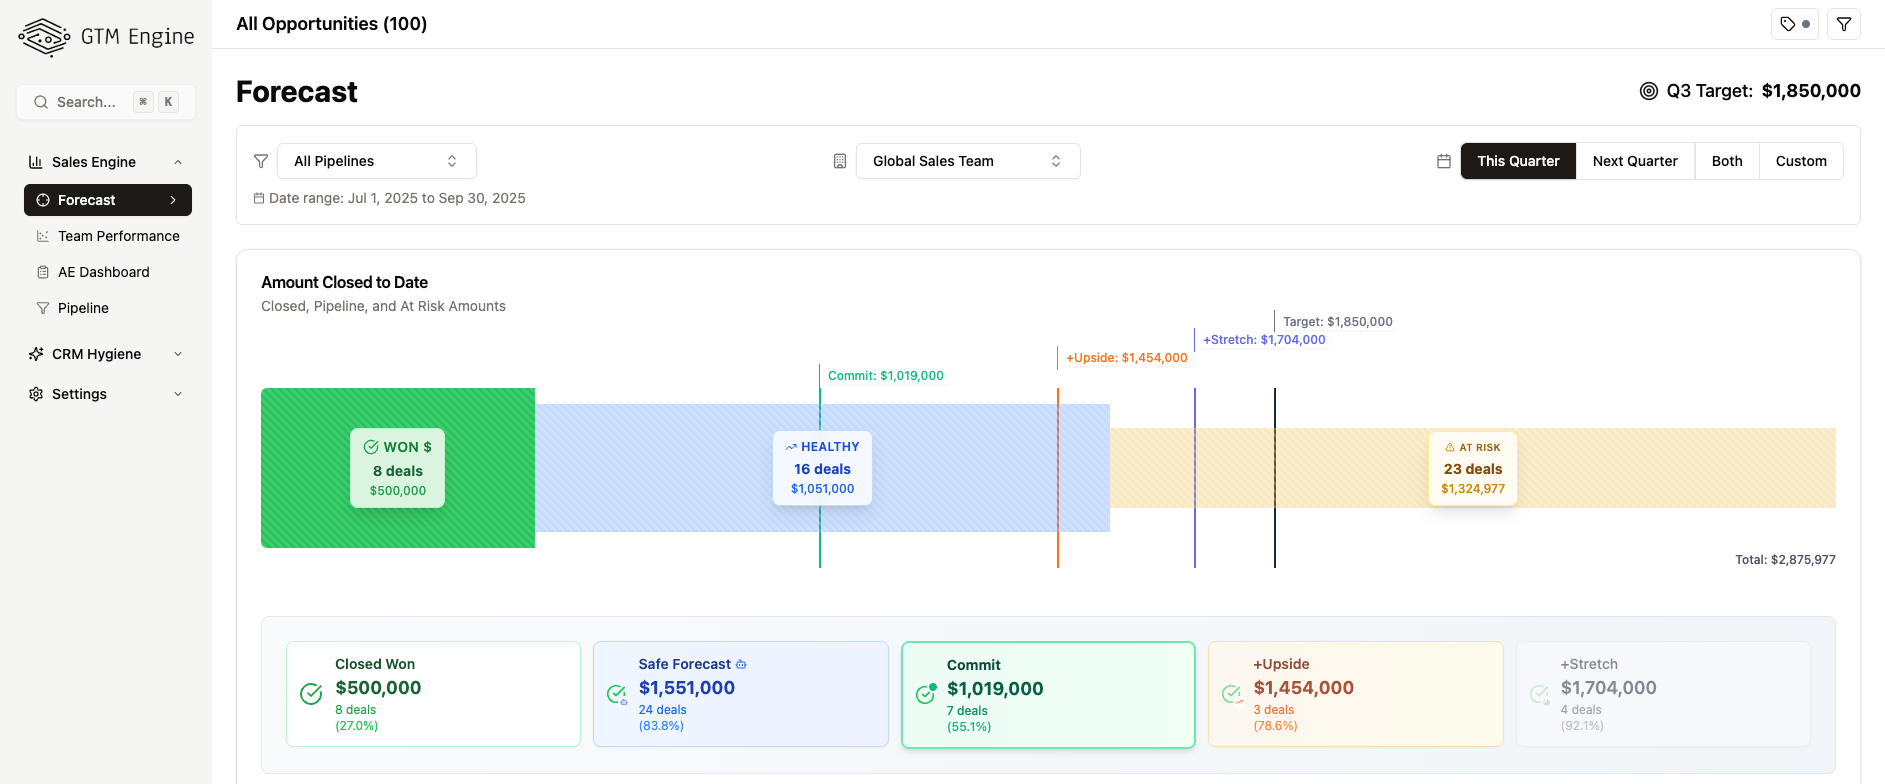
Understanding the Forecast Chart
The chart displays several key metrics for your selected time period:
- Closed Amount (Green)
- Represents deals that are closed-won
- Shows the total monetary value of these deals
- Healthy Pipeline (Blue)
- Shows deals that are progressing normally
- Represents your "safe forecast" - deals expected to close within the selected period
- Target Line
- Horizontal line indicating your sales target as set in your system settings
- Weighted Forecast Line
- Based on deal probability percentages
- Shows the expected value of deals factoring in their likelihood to close
- At-Risk Amount
- Displays deals that may be in jeopardy
- Represents potential revenue that requires attention
Analyzing Individual Opportunities
- Click on any category in the chart (Closed, Healthy, or At-Risk)
- A modal overlay will appear showing all opportunities in that category
- Click on any opportunity name within the modal
- You'll be directed to that opportunity's detail page in the pipeline view
Tips and Best Practices
- Regular Check-ins: Review your forecast at least weekly to identify changes in pipeline health
- Team Filtering: When managing multiple teams, start with the global view then drill down to identify specific areas needing attention
- Custom Date Ranges: Use custom date ranges to align with your specific sales cycles or reporting periods
- At-Risk Focus: Prioritize reviewing at-risk deals to identify rescue opportunities before they're lost
- Target Tracking: Keep an eye on the gap between your weighted forecast and target line to assess if additional pipeline generation is needed
- Opportunity Deep Dives: Use the click-through functionality to quickly investigate specific deals without losing your place in the forecast view
With the Forecast Module, GTM Engine transforms your CRM data into actionable insights that support real selling activities. Instead of spending time manually updating forecasts or compiling pipeline reports, you can instantly visualize your sales performance and focus your energy on the deals that matter most.
