
Feature Overview
The Account Executive (AE) Dashboard is your personalized command center within GTM Engine, designed specifically for sales representatives. This central hub provides a comprehensive view of your sales performance, pipeline health, and prioritized action items all in one place. The dashboard transforms scattered CRM data into actionable insights, helping you focus your time on the most impactful selling activities.
Benefits to the User
- Time-saving visibility: Quickly assess your progress toward quota and identify which opportunities need immediate attention
- Prioritized selling: Focus on deals that matter most with AI-driven health scores and opportunity insights
- Reduced administrative burden: Leverage auto-generated tasks and email drafts to streamline follow-up activities
- Proactive deal management: Identify and address blockers before they derail your opportunities
- Efficient planning: View upcoming activities alongside your pipeline for better time management
Accessing the Feature
- Navigate to the "Sales Engine" section in the main nav
- Click on "AE Dashboard", displaying four key components:
- Quota Command dashboard (top)
- Opportunities Needing Attention (bottom left)
- Upcoming Activities (bottom right)
- Tasks In Your Court (right rail)
Step-by-Step Usage Guide
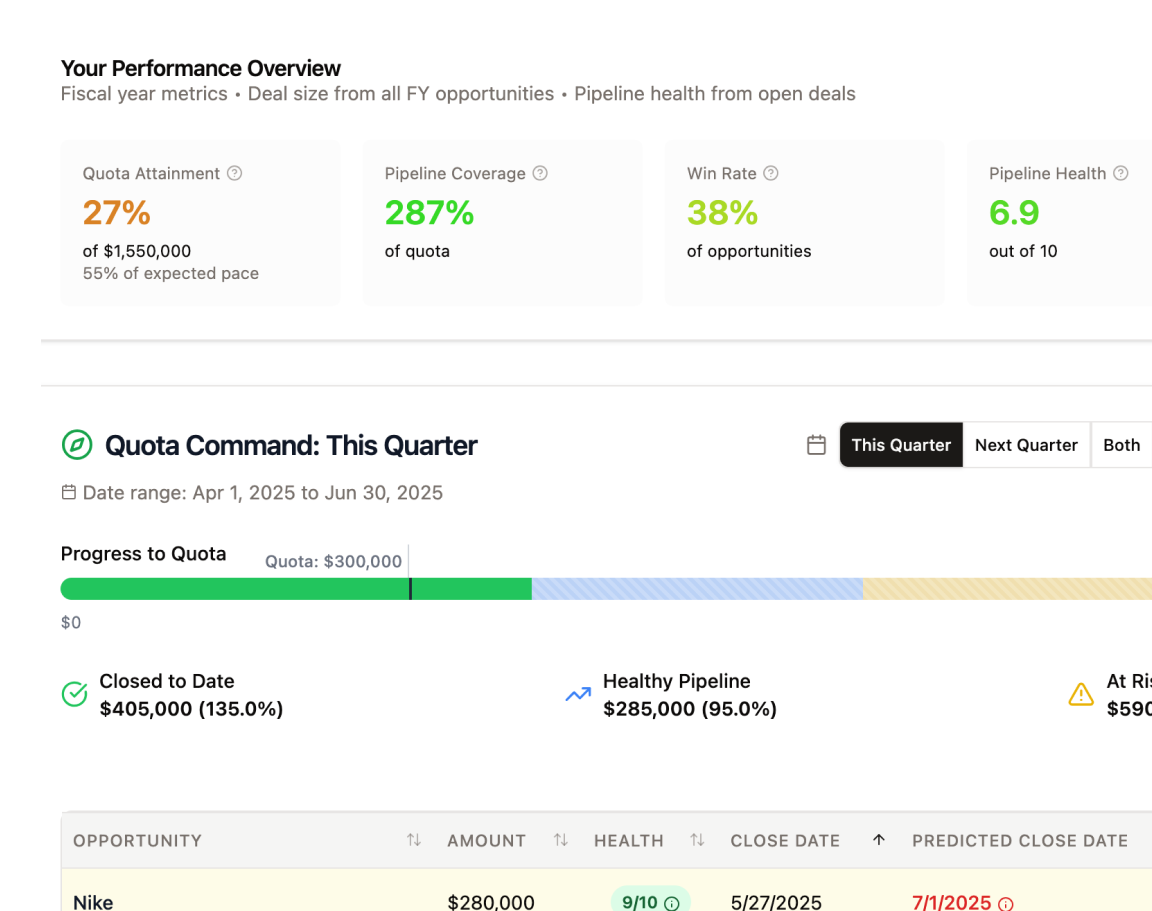
Understanding Your Quota Command Module
The Quota Command section at the top of your dashboard provides a snapshot of your sales performance:
- Date Range Selection:
- By default, the dashboard displays the current quarter
- Use the dropdown menu on the right to switch between:
- This quarter (default)
- Next quarter
- Both quarters
- Custom date range (specify start and end dates)
- Pipeline Filter:
- In the top right, select between:
- All pipelines
- Deal pipelines
- Renewal pipelines
- In the top right, select between:
- Progress Visualization:
- View your progress bar showing:
- Closed to date amount (green in graph)
- Healthy pipeline amount (blue in graph)
- At-risk pipeline amount (yellow in graph)
- Total quota target amount
- Weighted forecast amount - the expected value of deals factoring in their likelihood to close
- View your progress bar showing:
Customizing Your View
- Click the “Customize Columns” button in the top right corner
- Select the columns you want to display from:
- Standard Manual fields (including CRM data fields)
- GTM Engine AI fields
- GTM Engine Analysis fields
- Click the “Save Preferences” button and your grid view will update to show only your selected columns
- Alternately, should you want to revert changes, you can click the “Restore Defaults” button to have your initial view restored.
Analyzing Individual Opportunities
- Reviewing Predicted Close Dates:
- Predicted Close Dates highlighted in red indicate a quarter disagreement (AI predicts a different quarter than the rep)
- Click any “Predicted Close Date” field to open a detailed modal that shows:
- Confidence level of the prediction
- Days until predicted close
- Current stage analysis
- Deal gaps assessment
- Comparison to last week's forecast
- Comparison to the AE's listed close date
- Key factors influencing the prediction
- Suggested actions to close the deal
- Understanding Health Scores:
- Health Scores color codes:
- Green: Scores of 8 and above (healthy)
- Yellow: Scores between 5-7 (moderate risk)
- Red: Scores below 5 (high risk)
- Click on any “Health Score” field to open a detailed modal that shows view:
- Overall health score description
- Positive contributing factors
- Negative contributing factors
- Score change analysis based on recent digital touchpoints
- Summary of the health assessment
- Health Scores color codes:
- Using Path to Close:
- Click the Path to Close button in the action field of any opportunity
- Review suggested next steps on the left, categorized by priority:
- Critical path items
- Priority 1, 2, etc.
- Review current blockers identified on the right.
- For both, click Show Reasoning to understand:
- The reasoning behind this determination including any relevant evidence and how that affects the deal
- Accessing Full Pipeline View:
- Click View and Update Full Pipeline in the bottom center, directly below the opportunity grid to see your full pipeline details.
Tips and Best Practices
- Start your day with the dashboard: Begin each workday by reviewing your AE Dashboard to prioritize activities and identify urgent opportunities
- Use Path to Close strategically: Before customer calls, review the Path to Close for relevant opportunities to guide your conversation toward addressing blockers
- Monitor health scores: Track changes in opportunity health scores over time to identify trends and take proactive action
- Filter by pipeline type: When focusing on specific goals (new business vs. renewals), use the pipeline filter to streamline your view
Remember, GTM Engine's AE Dashboard is designed to transform your CRM from a passive reporting tool into an active system that supports real selling—giving you back valuable selling time while providing the insights you need to close more deals efficiently.
